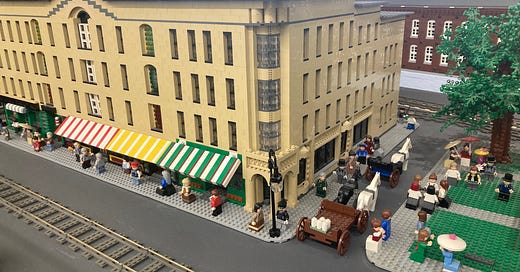
I was recently conducting some formative evaluation at the SEE Science Center testing an interactive to get people practicing close observation skills at its giant LEGO® model of a Manchester, NH Millyard circa 1900. And, I began thinking, for the umpteenth time, why I love maps and their 3D counterparts, models. Maps are one of the natural intersections between museum practice and urban/regional planning, which is my excuse to write this.1 Really, though - I just love the idea of maps as a source of museum content.
Maps Show Instead of Tell
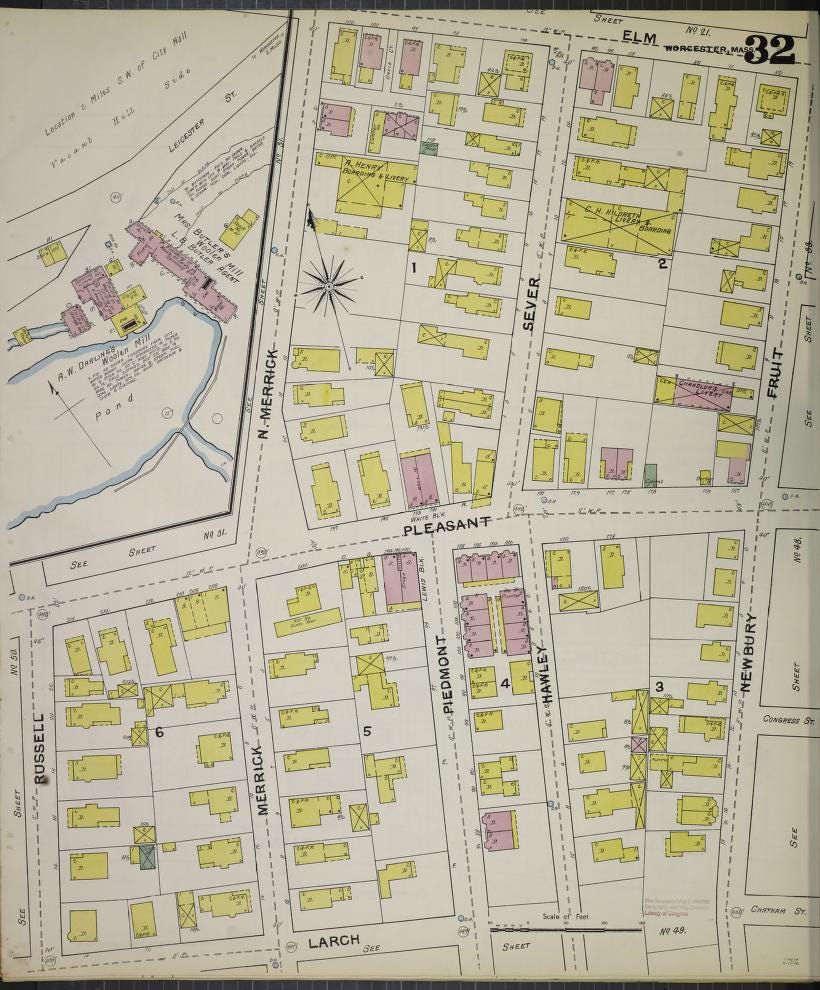
Maps are often beautiful, and according to a recent New York Times article, they are having their “moment” in interior design. But I also want to celebrate the fact that maps are a powerful tool for showing people the impact of design and development decisions on the literal shape of the built environment. Several years ago, my exhibit department colleagues, and I had a ball at the Worcester Historical Museum’s library pouring over old Sanborn fire maps of the city of Worcester. Flipping from year to year, we could see the city’s infrastructure change as the city grew: ponds would appear as farmers dammed streams and disappear when those farms were replaced by neighborhoods, water mains would jump from 6 to 8 to 10 inches as new housing developments sprang up, and the flagpole behind city hall stood steadfastly in one spot for decades.
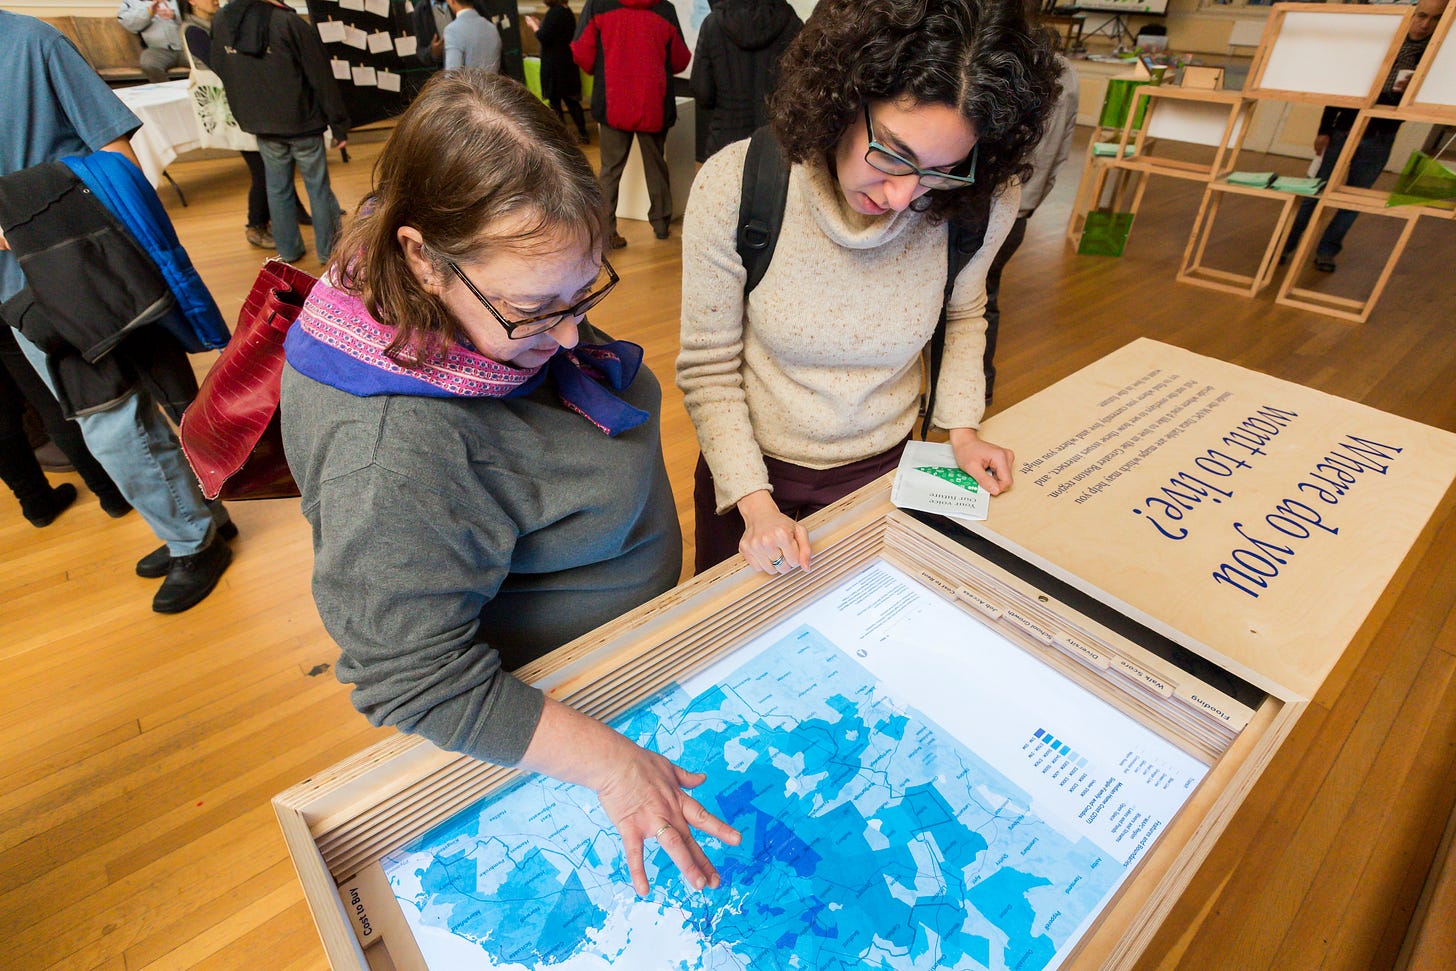
Planners understand the power of maps as a communication tool. The Metropolitan Area Planning Council made great use of maps at community engagement events during the development of MetroCommon 2050, the long-range regional plan for 101 communities of the Greater Boston area. This interactive below was a lovely low-tech GIS data map which posed the question, “Where do you want to live?” A backlit map of the region, with sliding layers of data such as flooding risk, walk score, diversity, job access, rental cost, allowing people to see how these data overlapped with each other and with the transit infrastructure.
And data maps are show up in a lot of climate engagement. As I mentioned in an earlier post, the city of Richmond, VA saw the obvious value of including in its plans the urban heat island maps generated by the Science Museum of Virginia and Groundwork RVA as a way to make the inequities of local climate impacts instantly understandable. And it is through maps that this pattern of disproportionate heat island effect in formerly red-lined neighborhoods is shown to be repeated dozens of U.S. cities studies through NOAA’s heat island initiative. And since I gave you the negative side of Boston’s climate readiness in my prior post discussing the Inundation District documentary, the City’s Climate Ready Boston initiative has this interactive map that includes data layers that let users look at the coincidence between flooding, heat islands, and social vulnerability indicators.
Maps, Mapmaking, and Models
Maps are great at conveying information, but only if people understand how to read them. You can argue whether the rise of GPS has made us better or worse at map-reading. (I tried and got a bit lost in a “demise-of-geography” hang-wringing rabbit hole.) But, with very few exceptions, none of us is born knowing how to read a map, and some of us remain map-challenged. Which makes map skills fantastic content for museum exhibits and programs.
I highly recommend David Sobel’s book Mapmaking with Children: Sense of Place Education for the Elementary Years. The book lays out children’s developmental stages in understanding the layout of their environment and in their ability to convey that environment symbolically.2
Sobel points out that for the youngest school children, a model is an easier way for them to depict their understanding of a place. In short, models are the gateway to maps. We leaned on this idea when we wanted a companion interactive for a GIS-based computer interactive that wasn’t developmentally accessible for children below mid-elementary age. In this companion interactive, we built a 3D model of the museum gallery, accompanied by a 2D map of the same space. Visitors could place objects into the model, asking their companion to put pictures of the objects into the corresponding spots on the map – and vice-versa. What’s beautiful about this simple interactive is that it reinforces symbolic thinking, translation from two to three dimensions, as well as the concept of scale.
Models are the gateway to maps.
My favorite moment observing this interactive came when an adult caregiver was surprised that her 3-year-old “got it.” It is always fun to lay bare for adults the new skills that their children have been quietly developing right under our noses. In this case, I was able to tell the adult about Sobel’s book and about Judy DeLoache’s shrinking room study that revealed children typically develop this particular symbolic thinking at three years old.
The bottom line is that maps, models, and map-making are a great entré into urban design and regional planning, but also outdoor education, measurement and math, communication, and a host of STEAM-y content. This video of Sobel is full of great ideas for mapmaking programs.
Your Brain on Maps
There’s a classic study of London cab drivers that showed that by building a mental map of the city required for licensure increased, the cabbies grew the area of the brain called the hippocampus. (And in classic fashion, this appears to be a “use it or lose it” effect, the hippocampi of retired cabbies revert back down to typical size.)
What excites me about this is that the drivers are actively building some of their spatial reasoning skills as adults. Which should mean that this is likely an even more malleable aptitude for children. Which excites me as someone invested in STEM education, because there is a correlation between spatial ability and STEM achievement in novice learners.
A leading researcher on this correlation is David Uttal at Northwestern, and his Spatial Thinking and Representations (STAR) Lab website is a fun place to geek out on this stuff. While, as we all learned, correlation isn’t causation, researchers like Utall are developing more nuanced understandings of whether and how training to improve spatial skills can impact STEM achievement. (Including the research that Uttal and Judy DeLoache did with Sophie Pierroutsakos diving deeper into young children’s symbolic thinking in shrinking room studies and the potential implications for educators.) This spatial training doesn’t necessarily need to be confined to the surroundings we can stand in. Utall introduced me to researchers here in Worcester, Florencia Anggoro and Benjamin Jee who’ve done research projects engaging kids in the modeling of objects and phenomena in our solar system.
So, maps are beautiful, they communicate a lot of information visually, they can let us see the past and envision the future, they give us an excuse to get outdoors, and they build our brains – or at least our ability to think symbolically and spatially.
What map-based work have you done? Please share! (betsy@exploringexhibits.com) I know I’m only scratching the surface.
~ Betsy3
The Planning-Curious Museum Person
Sharing stories and ideas for other Planning-Curious Museum People and for Museum-Curious Planning People.
And, once again, as soon as I load a post onto Substack, something shows up in my inbox that needs comment. In a recent Strong Towns newsletter, Ben (staff member Ben Abramson, I presume) says this: “I’m a lifelong map geek, first poring over atlases and encyclopedias as a child, then building and covering my walls with a map collection … But the more I read about the thing that I love, the more I’m forced to reconsider. The illuminating book "Seeing Like a State" offers a history of cartography, which shows that if anyone came to map your area, it was for military conscription, taxation, potential conquest, real estate speculation or other reasons that never seem to benefit the local residents (the trade term for this is “legibility”). In U.S. history, deceitful maps were used to pilfer lands from Native American tribes.”
Looking at the marketing description of the book, it looks more like a dive into the horrid history of urban planning than of maps, making it all the more relevant for this blog, but not necessarily an indictment of maps. But Ben rightly raises an important point - maps have been frequently used as weapons, so understanding who is currently wielding a map and why is critically important.
The caveat is that in the book and video, Sobel seems to draw his examples only from children in England and the U.S. I am hoping (though I haven’t dug into this) that this work has been tested with children in other parts of the world to see what variation and universality exists.
I’m Betsy Loring, founder of expLoring exhibits & engagement. I’ve got over 20 years’ experience in project management and exhibit development in multidisciplinary, indoor and outdoor museum settings. My services include exhibit master planning, content and interactive development, and writing, with a focus on hands-on STEM. I also offer staff training in exhibition planning, formative evaluation, and prototyping. My special interests include multi-institutional collaborations, peer-to-peer professional development, and of course – collaboration with municipal planning practitioners.


